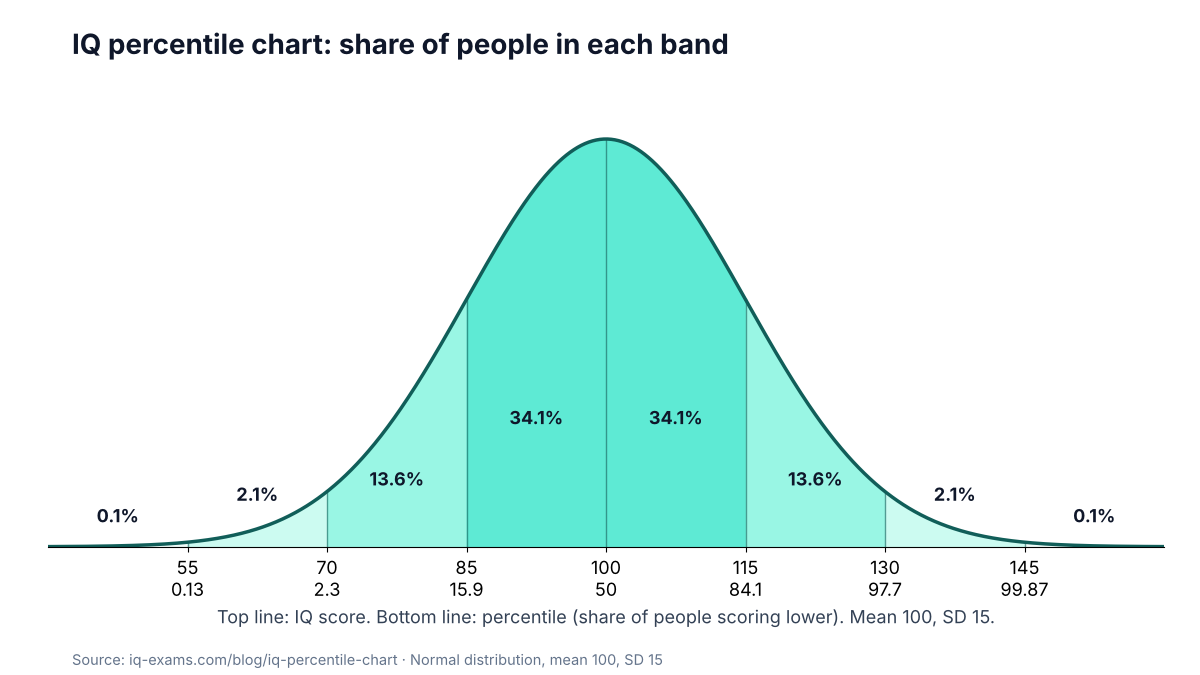
IQ scores are built so that 100 is the average and 15 points is one standard deviation. That single design choice fixes every percentile: an IQ of 115 beats about 84% of people, 130 beats about 98%, and 145 beats 99.9%. The table below lists the percentile for every single score from 55 to 160, with the share of people above it and the 1-in-N rarity, plus a chart you can download and reuse with a credit link.
How IQ percentiles are calculated
Every modern IQ test reports a deviation IQ: your raw score is compared with a norm group of people your age and placed on a normal distribution with a mean of 100 and a standard deviation (SD) of 15. The percentile is then simply the area under that curve to the left of your score, so it says what share of the population scores lower than you.
Because the distribution is symmetric, the numbers mirror each other around 100. Whatever share of people sits above 130 sits below 70 as well. That is also why the tails thin out so fast: each 15-point step away from the mean cuts the group roughly in half at first, and then by far more than half.
Two things the chart cannot tell you. First, no test measures you perfectly, so a score of 118 on a given day could be 113 or 123 on another; publishers quote a confidence interval for exactly this reason. Second, percentiles depend on the norm group. A score normed in 1995 and one normed in 2020 are not interchangeable because average performance drifts over time (the Flynn effect).
The IQ percentile chart at a glance
Full IQ percentile table: every score from 55 to 160
One row per IQ point, on the standard scale with a mean of 100 and an SD of 15. Percentile is the share of people who score lower. Share higher is the share who score higher. Rarity is how many people you would need to find one person this far from 100 or further: at or above the score for 100 and up, at or below it for scores under 100. Multiples of five are in bold. The table scrolls.
| IQ | Percentile | Share higher | Rarity (1 in N) |
|---|---|---|---|
| 160 | 99.9968 | 0.0032% | 1 in 31,574 |
| 159 | 99.9958 | 0.0042% | 1 in 23,873 |
| 158 | 99.9945 | 0.0055% | 1 in 18,127 |
| 157 | 99.9928 | 0.0072% | 1 in 13,822 |
| 156 | 99.9906 | 0.0094% | 1 in 10,584 |
| 155 | 99.988 | 0.012% | 1 in 8,139 |
| 154 | 99.984 | 0.016% | 1 in 6,285 |
| 153 | 99.979 | 0.021% | 1 in 4,874 |
| 152 | 99.974 | 0.026% | 1 in 3,795 |
| 151 | 99.966 | 0.034% | 1 in 2,968 |
| 150 | 99.957 | 0.043% | 1 in 2,331 |
| 149 | 99.946 | 0.054% | 1 in 1,838 |
| 148 | 99.931 | 0.069% | 1 in 1,455 |
| 147 | 99.914 | 0.086% | 1 in 1,157 |
| 146 | 99.89 | 0.11% | 1 in 924 |
| 145 | 99.87 | 0.13% | 1 in 741 |
| 144 | 99.83 | 0.17% | 1 in 596 |
| 143 | 99.79 | 0.21% | 1 in 482 |
| 142 | 99.74 | 0.26% | 1 in 391 |
| 141 | 99.69 | 0.31% | 1 in 319 |
| 140 | 99.62 | 0.38% | 1 in 261 |
| 139 | 99.53 | 0.47% | 1 in 215 |
| 138 | 99.44 | 0.56% | 1 in 177 |
| 137 | 99.32 | 0.68% | 1 in 147 |
| 136 | 99.18 | 0.82% | 1 in 122 |
| 135 | 99.02 | 0.98% | 1 in 102 |
| 134 | 98.83 | 1.17% | 1 in 85 |
| 133 | 98.61 | 1.39% | 1 in 72 |
| 132 | 98.36 | 1.64% | 1 in 61 |
| 131 | 98.06 | 1.94% | 1 in 52 |
| 130 | 97.72 | 2.28% | 1 in 44 |
| 129 | 97.34 | 2.66% | 1 in 38 |
| 128 | 96.90 | 3.10% | 1 in 32 |
| 127 | 96.41 | 3.59% | 1 in 28 |
| 126 | 95.85 | 4.15% | 1 in 24 |
| 125 | 95.22 | 4.78% | 1 in 21 |
| 124 | 94.52 | 5.48% | 1 in 18 |
| 123 | 93.74 | 6.26% | 1 in 16 |
| 122 | 92.88 | 7.12% | 1 in 14 |
| 121 | 91.92 | 8.08% | 1 in 12 |
| 120 | 90.88 | 9.12% | 1 in 11 |
| 119 | 89.74 | 10.26% | 1 in 9.7 |
| 118 | 88.49 | 11.51% | 1 in 8.7 |
| 117 | 87.15 | 12.85% | 1 in 7.8 |
| 116 | 85.69 | 14.31% | 1 in 7.0 |
| 115 | 84.13 | 15.87% | 1 in 6.3 |
| 114 | 82.47 | 17.53% | 1 in 5.7 |
| 113 | 80.69 | 19.31% | 1 in 5.2 |
| 112 | 78.81 | 21.19% | 1 in 4.7 |
| 111 | 76.83 | 23.17% | 1 in 4.3 |
| 110 | 74.75 | 25.25% | 1 in 4.0 |
| 109 | 72.57 | 27.43% | 1 in 3.6 |
| 108 | 70.31 | 29.69% | 1 in 3.4 |
| 107 | 67.96 | 32.04% | 1 in 3.1 |
| 106 | 65.54 | 34.46% | 1 in 2.9 |
| 105 | 63.06 | 36.94% | 1 in 2.7 |
| 104 | 60.51 | 39.49% | 1 in 2.5 |
| 103 | 57.93 | 42.07% | 1 in 2.4 |
| 102 | 55.30 | 44.70% | 1 in 2.2 |
| 101 | 52.66 | 47.34% | 1 in 2.1 |
| 100 | 50.00 | 50.00% | 1 in 2 |
| 99 | 47.34 | 52.66% | 1 in 2.1 |
| 98 | 44.70 | 55.30% | 1 in 2.2 |
| 97 | 42.07 | 57.93% | 1 in 2.4 |
| 96 | 39.49 | 60.51% | 1 in 2.5 |
| 95 | 36.94 | 63.06% | 1 in 2.7 |
| 94 | 34.46 | 65.54% | 1 in 2.9 |
| 93 | 32.04 | 67.96% | 1 in 3.1 |
| 92 | 29.69 | 70.31% | 1 in 3.4 |
| 91 | 27.43 | 72.57% | 1 in 3.6 |
| 90 | 25.25 | 74.75% | 1 in 4.0 |
| 89 | 23.17 | 76.83% | 1 in 4.3 |
| 88 | 21.19 | 78.81% | 1 in 4.7 |
| 87 | 19.31 | 80.69% | 1 in 5.2 |
| 86 | 17.53 | 82.47% | 1 in 5.7 |
| 85 | 15.87 | 84.13% | 1 in 6.3 |
| 84 | 14.31 | 85.69% | 1 in 7.0 |
| 83 | 12.85 | 87.15% | 1 in 7.8 |
| 82 | 11.51 | 88.49% | 1 in 8.7 |
| 81 | 10.26 | 89.74% | 1 in 9.7 |
| 80 | 9.12 | 90.88% | 1 in 11 |
| 79 | 8.08 | 91.92% | 1 in 12 |
| 78 | 7.12 | 92.88% | 1 in 14 |
| 77 | 6.26 | 93.74% | 1 in 16 |
| 76 | 5.48 | 94.52% | 1 in 18 |
| 75 | 4.78 | 95.22% | 1 in 21 |
| 74 | 4.15 | 95.85% | 1 in 24 |
| 73 | 3.59 | 96.41% | 1 in 28 |
| 72 | 3.10 | 96.90% | 1 in 32 |
| 71 | 2.66 | 97.34% | 1 in 38 |
| 70 | 2.28 | 97.72% | 1 in 44 |
| 69 | 1.94 | 98.06% | 1 in 52 |
| 68 | 1.64 | 98.36% | 1 in 61 |
| 67 | 1.39 | 98.61% | 1 in 72 |
| 66 | 1.17 | 98.83% | 1 in 85 |
| 65 | 0.98 | 99.02% | 1 in 102 |
| 64 | 0.82 | 99.18% | 1 in 122 |
| 63 | 0.68 | 99.32% | 1 in 147 |
| 62 | 0.56 | 99.44% | 1 in 177 |
| 61 | 0.47 | 99.53% | 1 in 215 |
| 60 | 0.38 | 99.62% | 1 in 261 |
| 59 | 0.31 | 99.69% | 1 in 319 |
| 58 | 0.26 | 99.74% | 1 in 391 |
| 57 | 0.21 | 99.79% | 1 in 482 |
| 56 | 0.17 | 99.83% | 1 in 596 |
| 55 | 0.13 | 99.87% | 1 in 741 |
Values computed from the standard normal distribution, mean 100, SD 15; percentiles rounded to two decimals, or to two significant digits of the tail above 99 and below 1. Rarity rounded to the nearest whole number above 10.
Which IQ do you need for the top 10%, 2% or 1%?
The same curve read the other way: the score that marks the start of each top group.
| Top group | IQ at the cut-off (SD 15) | 1 in N |
|---|---|---|
| Top 50% | 100.0 | 1 in 2 |
| Top 25% | 110.1 | 1 in 4 |
| Top 10% | 119.2 | 1 in 10 |
| Top 5% | 124.7 | 1 in 20 |
| Top 2% | 130.8 | 1 in 50 |
| Top 1% | 134.9 | 1 in 100 |
| Top 0.5% | 138.6 | 1 in 200 |
| Top 0.1% | 146.4 | 1 in 1,000 |
| Top 0.01% | 155.8 | 1 in 10,000 |
The top 2% line (130.8) is the one people ask about most, because Mensa admits people who score in the top 2% of the population on an accepted, supervised test. More on that in Mensa requirements.
How scores are labelled
A percentile is a number; a label is a convention, and publishers do not all use the same words. The Wechsler Adult Intelligence Scale, fourth edition (WAIS-IV, Wechsler, 2008), uses: 130 and above very superior, 120–129 superior, 110–119 high average, 90–109 average, 80–89 low average, 70–79 borderline, 69 and below extremely low. Newer Wechsler editions replaced several of those words with neutral ones such as very high and very low for the same score bands. Whatever the words, the percentile in the table above does not change. For what counts as a good score in everyday terms, see what is a good IQ score?, and for a plain-language reading of one score, open its page, for example what an IQ of 120 means or what an IQ of 130 means.
Reading the chart: three worked examples
IQ 112. Percentile ≈ 79. Roughly four in five people score lower. On a classroom of 30, that is about the sixth-best score, and a comfortable “high average”.
IQ 128. Percentile ≈ 97. About 1 in 32 people. Close to the Mensa line but not over it; a retest could land on either side, which is why Mensa uses supervised tests with known error margins rather than one online result.
IQ 142. Percentile ≈ 99.7. About 1 in 390. In a company of 2,000 employees you would expect around five people at this level or higher, regardless of role.
Why SD 15 matters when you compare tests
Not every scale uses 15. The older Cattell scale used SD 24, which is why “Cattell IQ 148” is the same percentile as Wechsler 130. Some European tests used SD 16 for decades. If a website quotes an IQ without saying which SD it uses, its percentiles cannot be checked against this chart. Every score on THEIQTESTS.COM is reported on the SD 15 scale, and the methodology page explains how the raw score becomes an IQ.
The percentile is also the number worth remembering rather than the IQ itself. “Top 9%” means the same thing whatever the scale; “IQ 120” only does once you know the SD.
Method, sources and how to cite this chart
Method. Every value on this page comes from one formula: percentile = Φ((IQ − 100) / 15) × 100, where Φ is the cumulative standard normal distribution. Rarity is 1 divided by the tail share. Nothing here is estimated from test-takers; the numbers are what the IQ scale is defined to mean. Real tests report scores with a margin of error, and real samples are never perfectly normal in the far tails, so treat anything beyond about 145 as a property of the scale rather than a head count.
Sources. The mean-100, SD-15 deviation IQ is the convention of the Wechsler scales (WAIS-IV, Wechsler, 2008) and of the Stanford-Binet Fifth Edition (Roid, 2003). The labels above are the WAIS-IV descriptors. The Mensa cut-off is the top 2% as set by Mensa. How online takers actually spread is a different question: our 2026 data study of 3,834 completed tests describes our own self-selected online sample, not the population.
Frequently asked questions
What percentile is an IQ of 120?
About the 91st percentile: roughly 9 in 100 people score 120 or higher on an SD 15 scale.
What IQ is the top 1%?
An IQ of about 135 marks the 99th percentile. Mensa’s cut-off is the top 2% (the 98th percentile), which starts at an IQ of about 131 (130.8) on SD 15 scales.
What percentage of people have an IQ above 130?
About 2.3%, or roughly 1 in 44 people.
How rare is an IQ of 145?
About 1 in 741 people score 145 or higher, the 99.87th percentile. Three standard deviations above the mean.
Is an IQ of 100 exactly the median?
Yes. The scale is defined so that 100 is both the mean and the median of the norm group, so half of people score below 100 and half above.
Where do you land on the chart?
The test is free to take and needs no account to start. See where you stand.
Take the Free IQ Test